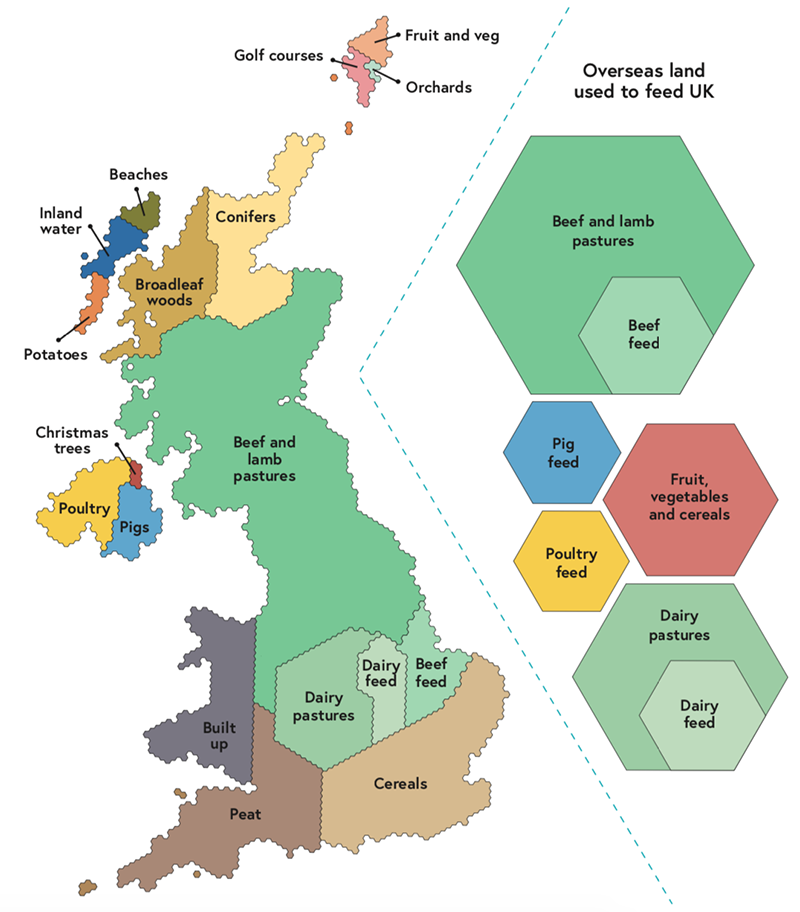
A startling UK map showing how much we use land for animal agriculture - and how much solar is crowded out
UK land area divided up by purpose. About 70% is devoted to agriculture, mainly livestock and livestock feed and pasture. The right-hand side of the chart, using the same scale, shows how much land is used overseas to produce food for the UK. About half of the total land use takes place overseas. The combined land area for rearing beef and lamb for UK consumption is larger than the UK itself. Source: The National Food Strategy, Part II.
We’re attentive and respectful to vegan takes on the climate crisis - and the often-repeated injunction for us to reduce the level of meat intake in our lives, as a tangible contributor to global warming and environmental degradation. So we thought our friends would appreciate this graphic, brought to us by Carbon Brief, mapping out land use for agriculture in the UK, and the amount of land used to make food for the UK as import.
We were alerted by a tweet from Carbon Brief’s Simon Evans, who wanted to show his estimate that, by this measure, “solar farms cover less than one tenth of one percent of the UK – 0.08”. In the tweet embedded below, he shows his workings:
Looks like we have plenty of opportunity to get more of our landmass solarized, if we make the changes in diet that the National Food Strategy recommends (which this graphic comes from, and which we have covered - see also our Food archive).

